Clinical studies have shown that factor IX spends more than half of its total time in the body outside the plasma3,5
Hemophilia B is different. Let’s manage it that way

Explore the differences between factor VIII and factor IX

Learn more about evaluating multiple pharmacokinetic (PK) parameters

See the additional considerations for the management of hemophilia B
Due to the distinct behavior of factor IX, multiple PK parameters should be considered when assessing bleed prevention. Learn how a broader view of PK may influence evaluation of treatment and management for patients with hemophilia B.1,2
Hemophilia A and hemophilia B are different bleeding disorders with unique pathologies and clinical features3
| Hemophilia A3,4 | |
|---|---|
| Prevalence | 1:5,000 males |
| Clinical symptoms | Joint bleeding, muscle hematoma, soft tissue bleeding |
| Coagulation factor deficiency | Factor VIII |
| Patients with severe factor VIII deficiency | ~50% |
| Annual bleed rate in moderate to severe patients | 14-16 |
| Hemophilia A3,4 | |||||||||
|---|---|---|---|---|---|---|---|---|---|
| Prevalence: | 1:5,000 males |
| Clinical symptoms: | Joint bleeding, muscle hematoma, soft tissue bleeding |
| Coagulation factor deficiency: | Factor VIII |
| Patients with severe factor VIII deficiency: | ~50% |
| Annual bleed rate in moderate to severe patients: | 14-16 |

| Hemophilia B3,4 | |
|---|---|
| Prevalence | 1:30,000 males |
| Clinical symptoms | Joint bleeding, muscle hematoma, soft tissue bleeding |
| Coagulation factor deficiency | Factor IX |
| Patients with severe factor IX deficiency | ~30% |
| Annual bleed rate in moderate to severe patients | 9-11 |
| Hemophilia B3,4 | |||||||||
|---|---|---|---|---|---|---|---|---|---|
| Prevalence: | 1:30,000 males |
| Clinical symptoms: | Joint bleeding, muscle hematoma, soft tissue bleeding |
| Coagulation factor deficiency: | Factor IX |
| Patients with severe factor IX deficiency: | ~30% |
| Annual bleed rate in moderate to severe patients: | 9-11 |
- Since bleeding phenotype may differ between severe hemophilia A and B, management strategies should be individualized1
Discover the differences between factor VIII and factor IX
Factor VIII and factor IX have unique pharmacokinetic profiles and behave differently in the body1,2,5-7
Click on the icons to learn more
- The 4 key PK differences between factor VIII and factor IX are
clearance,
recovery, and
volume of distribution.8-13


- Factor VIII and factor IX are unique blood-clotting proteins with distinct functions in the coagulation cascade5-7
Look outside the plasma to further understand factor IX
The unique pharmacokinetic profile of factor IX is explained by its widespread distribution in the extravascular space5,8-10
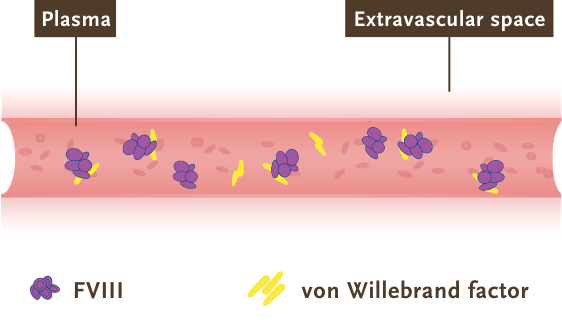
- Factor VIII: largely influenced by its association with von Willebrand factor (vWF), which restricts factor VIII circulation to the bloodstream and limits its extravascular distribution5,12,14
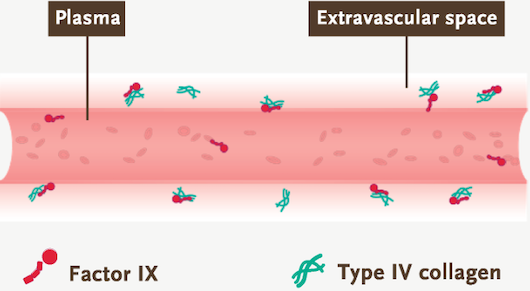
- Factor IX: greatly influenced by its extravascular distribution and type IV collagen binding. The unique distribution behavior of factor IX allows for its longer half-life5,10,15*
*As shown from research of factor IX binding to type IV collagen in human arterial tissue in vitro.
See why these differences may matter
Compartment models are commonly used to describe the PK of therapies such as factor VIII and factor IX5,14
The PK of infused factor VIII may be described by a 2-compartment model5
- After infusion of factor VIII, there is a rapid distribution phase (binding to vWF), followed by elimination. Therefore, its PK may be described by the 2-compartment model5
- However, this early, rapid phase of distribution to vWF rarely contributes to a noticeable difference in the area under the curve (AUC), allowing for an easier PK analysis16
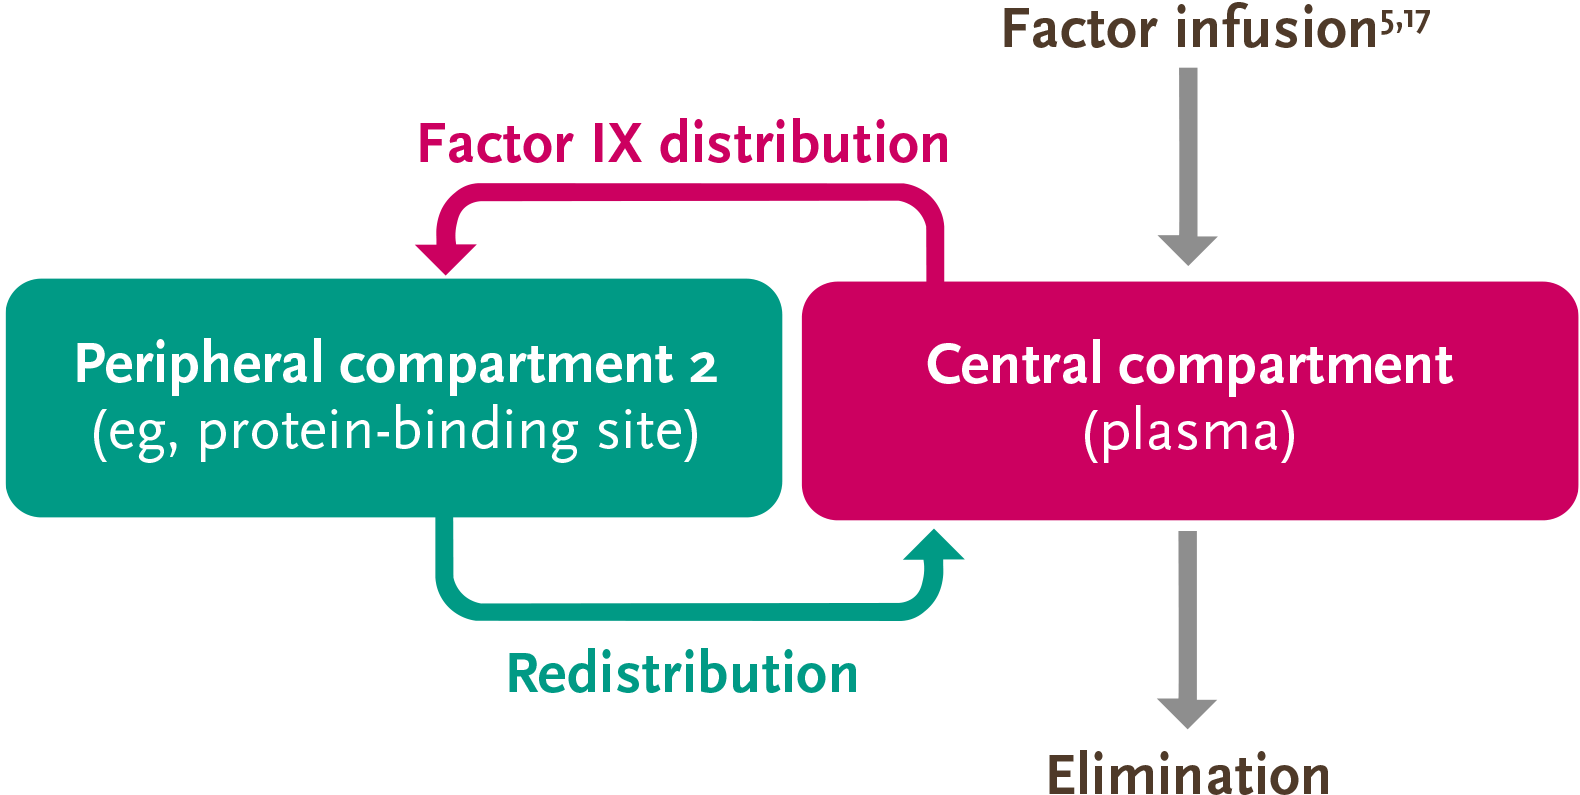

The PK of factor IX can be described by the 3-compartment model, so accurate measurement of its activity is more complex than that of factor VIII5
Due to the distribution of factor IX outside of the plasma and into the extravascular space, the PK behavior is more complex than that of factor VIII5,13
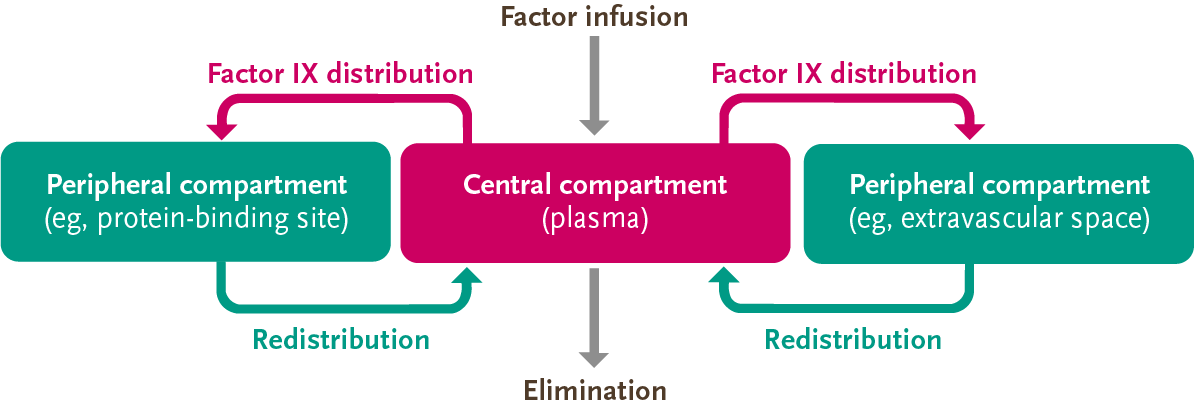
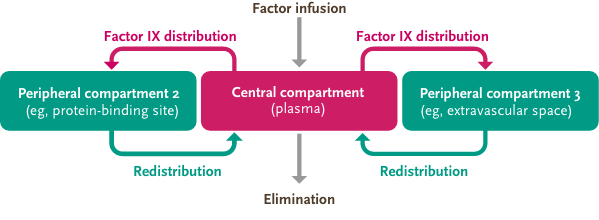
Adapted from Iorio, et al. Thromb Haemost. 2017.
- After factor IX enters the plasma, it rapidly distributes into peripheral compartments and eventually redistributes into the central compartment for elimination5
Because factor IX may reside in 3 different compartments, and trough only accounts for one compartment (plasma), trough may not account for all the factor IX activity in the body.5,13


Understand the activity of factor IX in the extravascular space
Factor IX binds to type IV collagen, which may play a key role in coagulation15,18
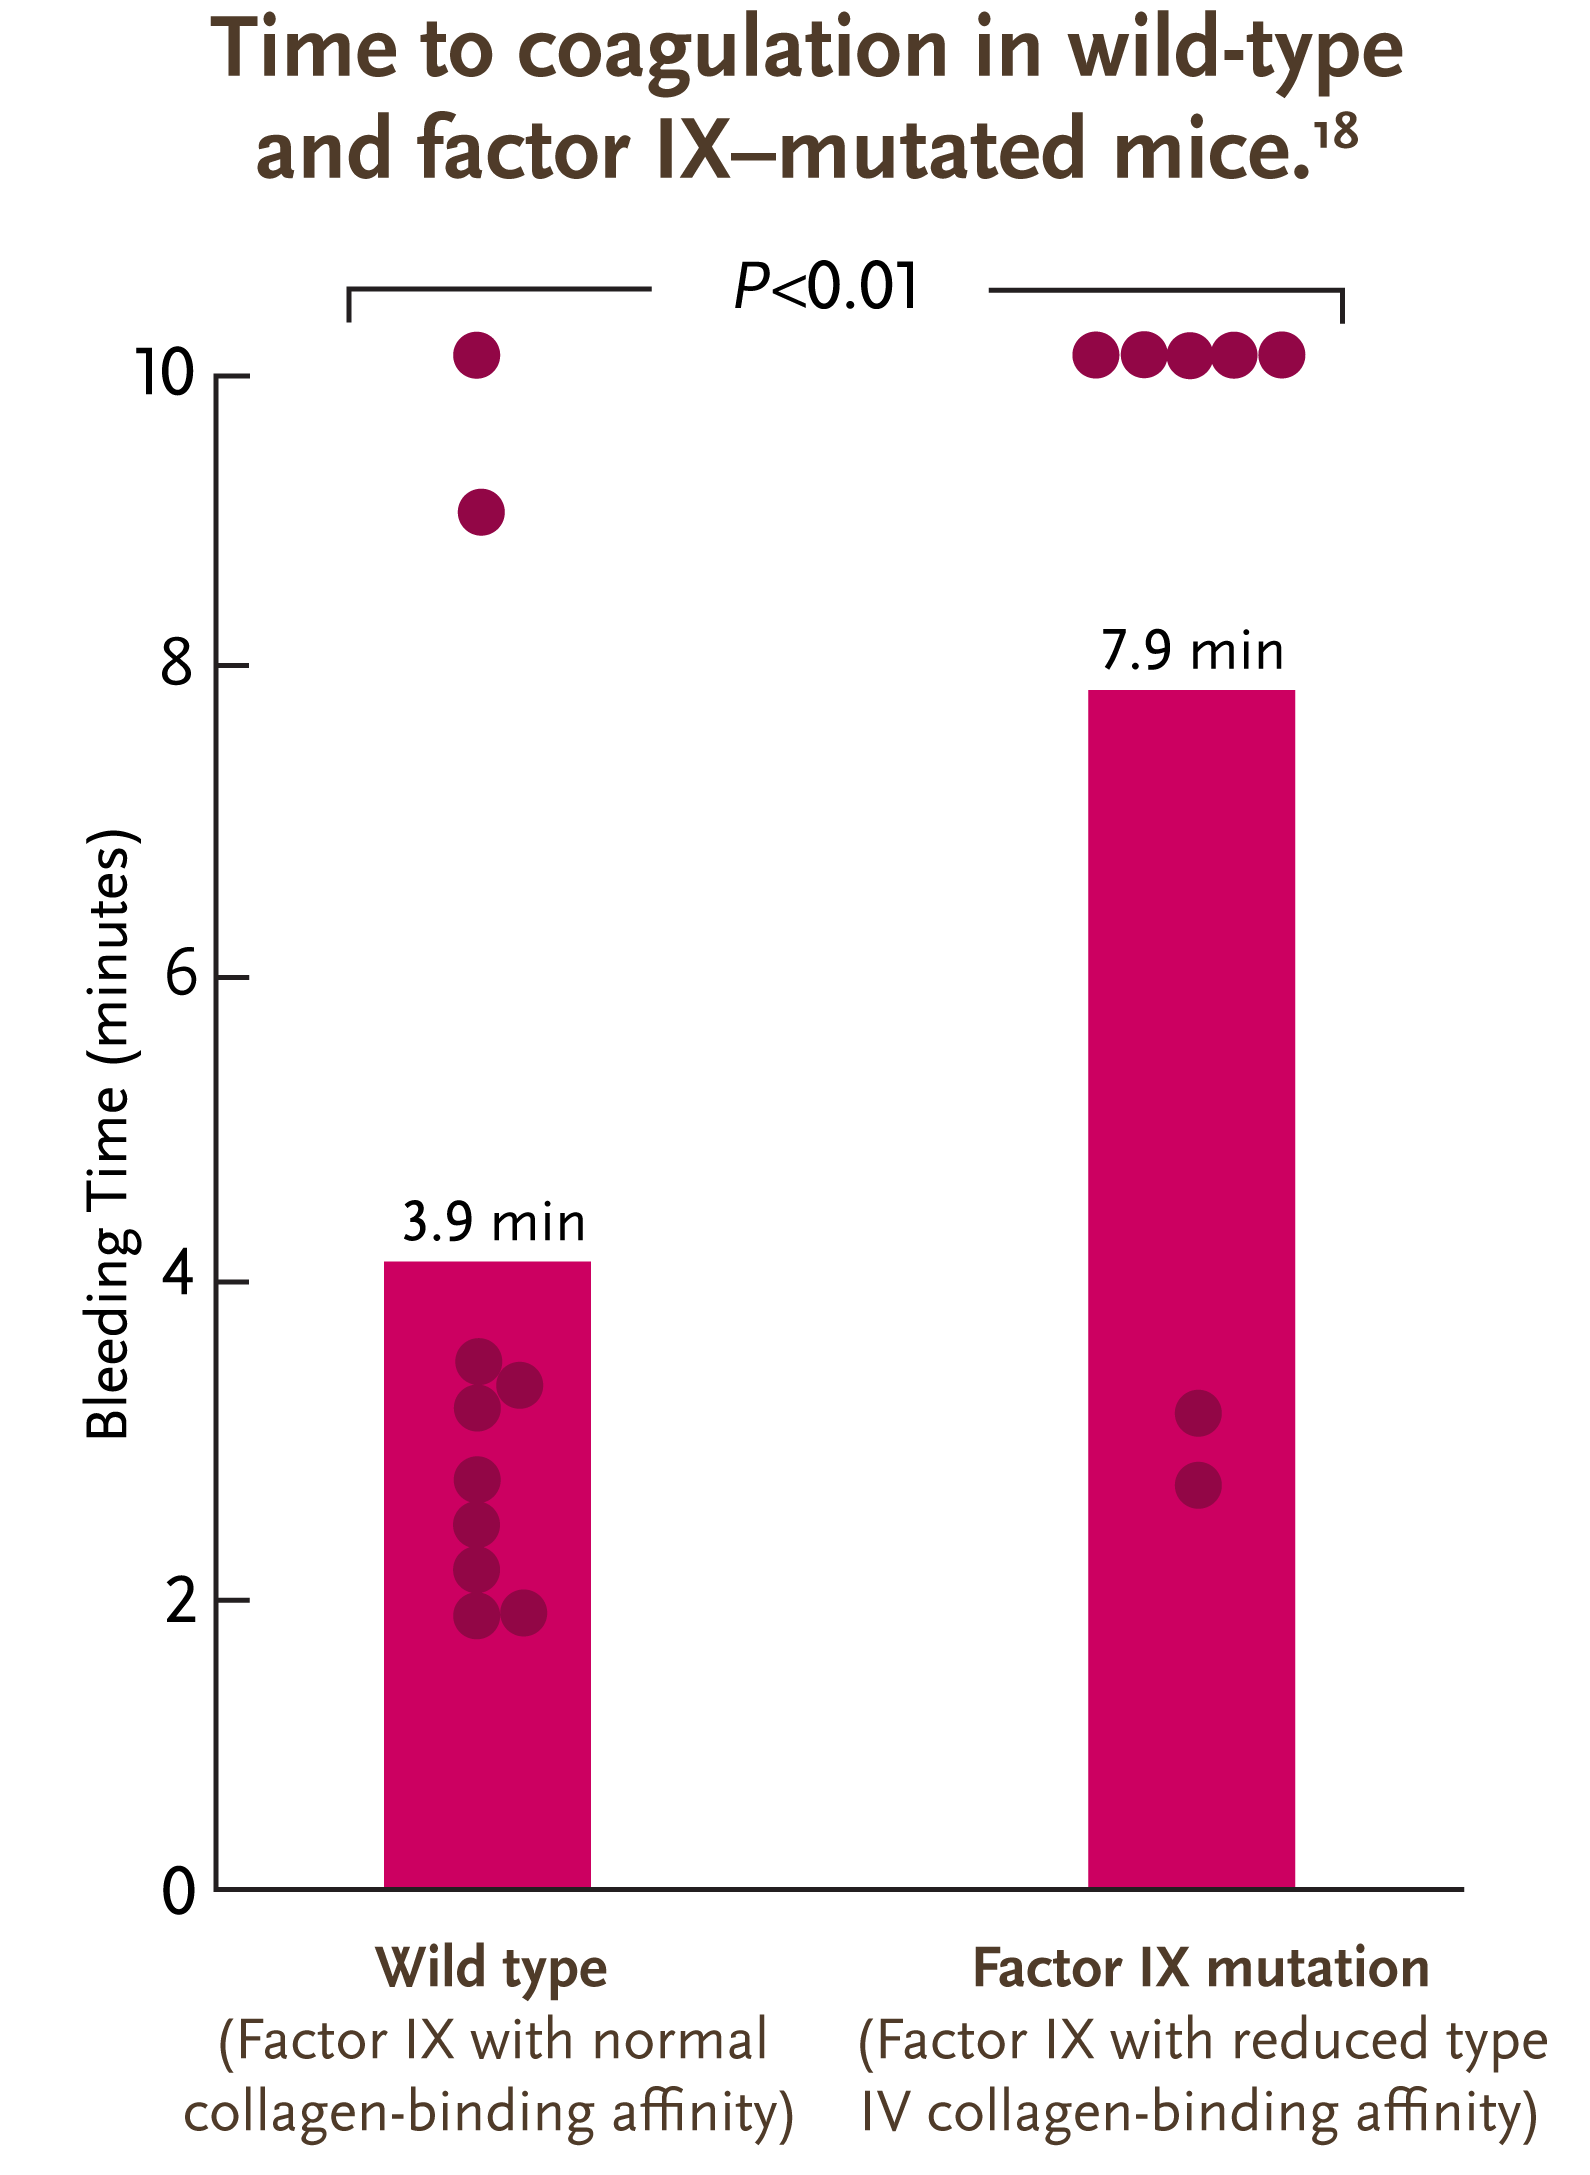
- A study in mice demonstrated that factor IX binds to type IV collagen in the extravascular space15
- A higher affinity to type IV collagen is associated with a significant reduction in bleeding time8
Adapted from Gui et al. J Thromb Haemost. 2009.
Additional research in humans is needed to confirm these findings.8
Purple dots represent the length of bleeding time from time of tail clip to bleeding cessation for each mouse. After 10 minutes, bleeding was terminated by firm pressure. Solid purple bars indicate mean bleeding times for the groups.
- A study in mice demonstrated that factor IX binds to type IV collagen in the extravascular space15
- A higher affinity to type IV collagen is associated with a significant reduction in bleeding time8

Adapted from Gui et al. J Thromb Haemost. 2009.
Additional research in humans is needed to confirm these findings.8
Purple dots represent the length of bleeding time from time of tail clip to bleeding cessation for each mouse. After 10 minutes, bleeding was terminated by firm pressure. Solid purple bars indicate mean bleeding times for the groups.
View the different PK parameters
Due to the complexity of factor IX, evaluation of factor IX replacement therapies should look at multiple PK indicators5
Parameters

Peak
Maximum concentration observed after infusion13
Because other PK parameters may not provide the full picture of factor activity when considered alone, peak should be considered as part of a more comprehensive evaluation19

Volume of distribution
Drug distribution in the plasma and rest of the body2,13
Additional research is needed to understand the clinical implications of volume of distribution

AUC
Total concentration in the body in a given period of time13
AUC should be considered as part of a more comprehensive evaluation because other PK parameters may not provide the full picture of factor activity when considered alone19

Clearance
Amount of plasma free of drug in a given period of time5,13
The representation of clearance in the multicompartment model may explain why the half-life of factor IX is longer than that of factor VIII, even though factor IX clearance is higher5

Half-life
Time to half of initial concentration13
Because half-life may be affected by the extravascular distribution of factor IX, considering it alone may not provide the full picture of factor activity. Extravascular distribution may complicate the PK analysis of terminal half-life because the estimate will be different depending on the compartment model used5,13

Trough
Minimum concentration1,2
Evaluating trough alone during a PK assessment may not measure protection due to the complex behavior of infused factor IX20
Examine the implications of extravascular factor IX distribution on trough levels
Trough levels, which measure factor in the plasma, may not always correlate with bleed rates1,2
Although clinical trials have not directly compared extended half-life factor IX replacement drugs, individual trials have shown21,22:


A broad range of trough levels 1% to 27%


A narrow range of bleed rates
1.04 to 1.40
Consider the implications of these clinical data
Multiple considerations may be needed to help evaluate the treatment and management of hemophilia B5,13
- Due to the distinct behavior and extravascular distribution of factor IX, there is a need to consider hemophilia B as a unique bleeding disorder5,13
- Trough alone may not provide a full picture of factor IX activity and should be one of multiple ways we measure bleed prevention in hemophilia B1,2,19,24,25
- A more complete PK assessment (including half-life, trough, peak, AUC, clearance, and volume of distribution) may provide a different way of thinking about bleed prevention in hemophilia B1,2,5,13,26
- A patient-centered approach that includes evaluation of bleed rates, joint bleed prevention, adherence, and quality of life should be considered when assessing your patients with hemophilia B25,27
Questions?

Back to the top


